Is the Magic Number a bad party trick?
Support for Mostly metrics comes from Aleph, the single source of truth for financial data. Accelerate FP&A and make better decisions using the tool you love the most—spreadsheets.

Before we make the numbers dance, make sure to check out this week’s Run the Number’s Podcast with Sinohe Terrero, the CFO of Envoy.
We talk about why CFOs should actually say “yes” more, building world class BI teams within finance orgs, and EQ vs IQ as a finance leader.
You listen on:
Also, Sinohe once met Fat Joe, who does the intro to our podcast. So there’s that.
The Art
The magic number is a colonoscopy of sorts on the health of your company’s ARR (annual recurring revenue) growth. It’s a SaaS performance metric that assesses overall ARR efficiency – meaning not just new ARR growth (which CAC Payback Period and Blended CAC Ratio take care of).
The “Art” of the Magic Number is that it bundles up everything that goes into Total ARR – New, Expansion, Churn, Shrink – for better or worse.
The Science
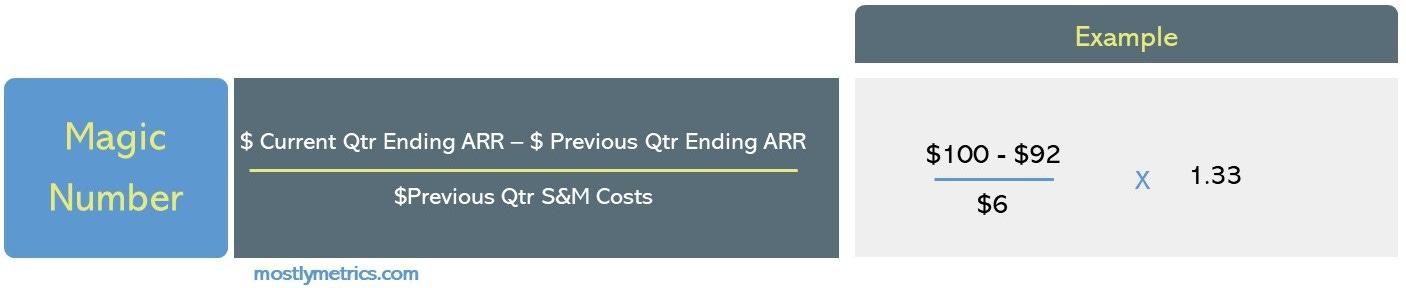
Take your Current Quarter’s ending ARR at the close of the period and subtract the Previous Quarter’s ending total. What you now have is your Net Change in ARR. This will have the effect (affect?) of baking in new customer sales, existing customer expansion, existing customer renewal, existing customer churn, and existing customer shrink.
Then divide your Net Change in ARR by whatever you spent on Sales and Marketing costs in the Previous Quarter. We lag the cost by one quarter to assume new deals take one quarter to materialize after putting money out into the universe.

Your Magic Number will be penalized if:
- Go to market spend is wasted (crappy marketing, poor sales execution),
- If your churn is high (customers bounce)
- The market has issues (saturation, competitive forces).
Bigger is better when it comes to the magic number. You want it to go up over time, demonstrating leverage on each S&M dollar you put into the world, and proving that your market share is going up.
Mostly metrics is a reader-supported publication. To receive new posts and support my work, consider becoming a free or paid subscriber.
Subscribed
A bigger magic number is better than a smaller magic number. Speaking of that…
What Good Looks Like
The inventor of the SaaS metric explains:
“Fundamentally, the key insight is that if you are below 0.75 then step back and look at your business, if you are above 0.75 then start pouring on the gas for growth because your business is primed to leverage spend into growth. If you are anywhere above 1.5, call me immediately.”
–Source: Lars Leckie, Investor

We can apply this filter to real companies. I engaged the pros at Virtua Research to run a bunch of companies through the Magic Number gauntlet. Here’s what Bill.com, Crowdstrike, and DataDog look like on a trailing twelve month basis in each of the past 6 quarters.
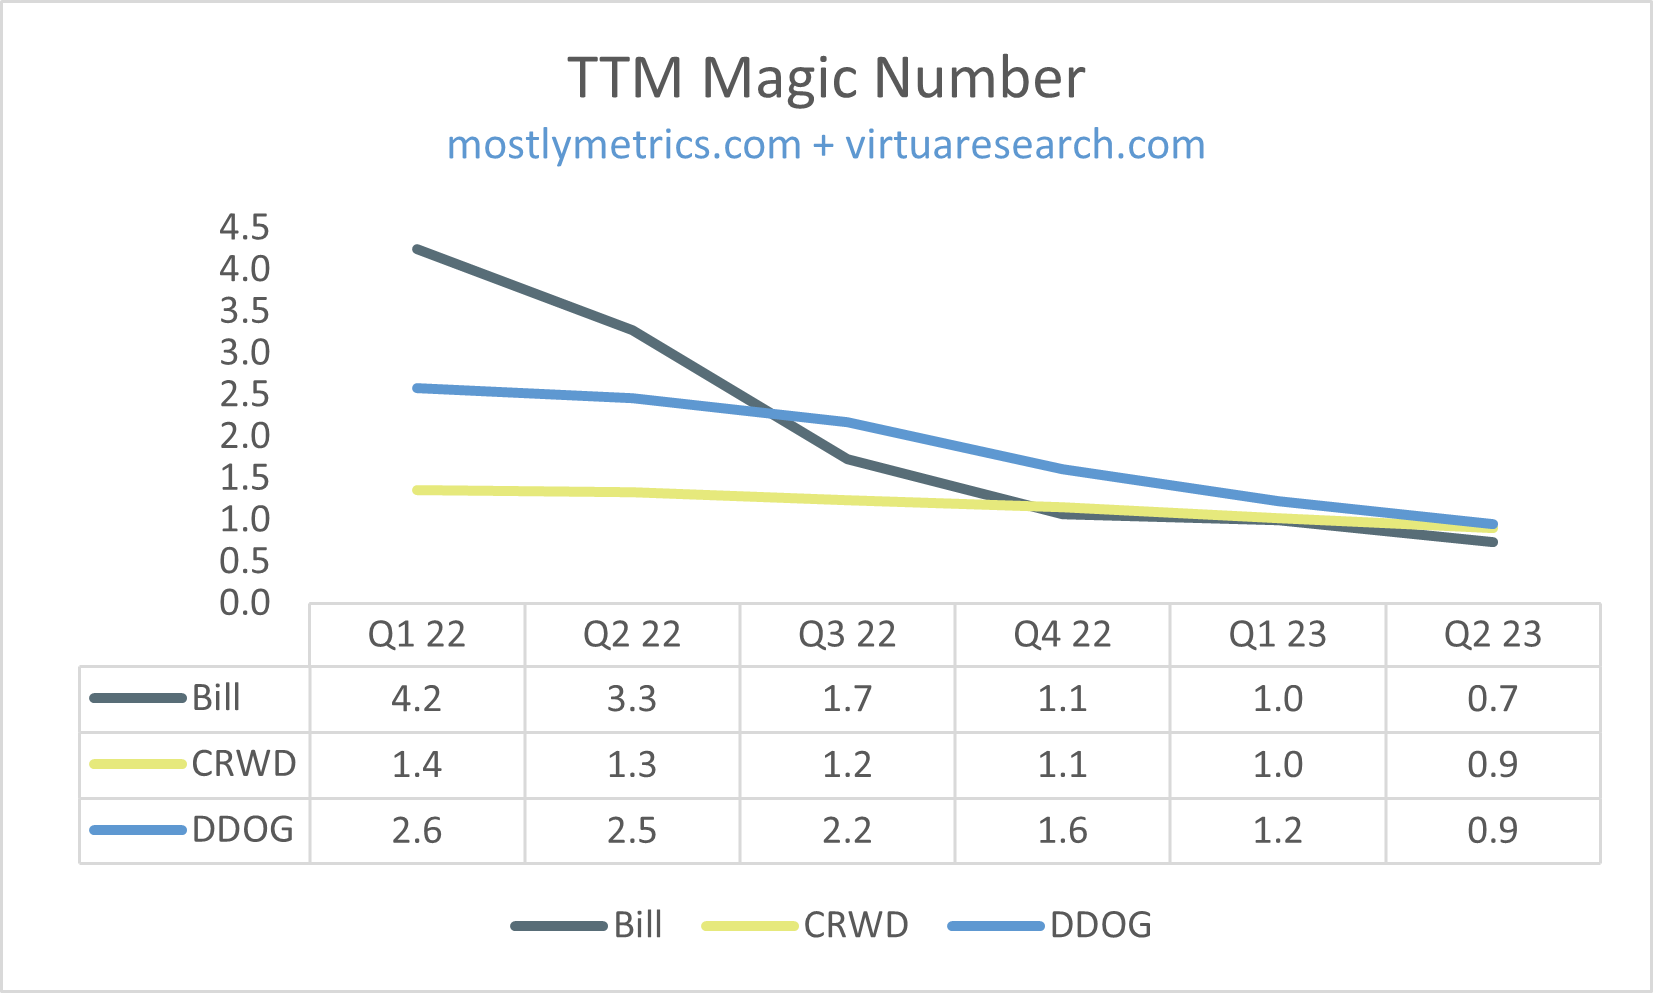
The results are very cloudy, and perhaps even misleading.
- DDOG, BILL = Have a “good” magic number but declining new ARR
- DDOG, BILL, SPLK = Have a “good” magic number but a declining Net dollar retention rate
- DDOG, BILL = Have a “good” magic number but have a increasing CAC payback period
You can clearly see them all going down towards the ~1.0 range. Which would technically give you all green lights if you looked at that quarter in a vacuum and ignored the downward trend. But if you did care about why they were trending down, you’d have to really roll up your sleeves, like this:

The Flaws

What’s nice about the Magic Number is that it includes down sell and churn. What’s bad about the Magic Number is it includes down sell and churn.
It includes A LOT of stuff. In fact, it’s one of the most compound of compound metrics.
- Too many topline levers: Total ARR growth is an output with many inputs
- Lack of ownership: There’s no one person at a SaaS company who owns the Magic Number. So if it’s broken you can’t appoint one person to fix it.
- Evolving team structures: Most SaaS companies now have matured to having different teams responsible for new customers (AEs, BDRs) vs existing customer expansion (Customer Success) vs existing customer problem solving (Customer Support).
- Total ARR has costs: It’s missing gross margin cost that’s baked into your cost to serve. And part of the reason customers may be leaving is because you are underinvesting in Customer Support resources (“Why the hell is no one picking up the phone???”)
- Low-ish goal to strive for: It’s kind of a weak benchmark, considering the median from 1,880 companies surveyed came in > 0.75. It’s a great number to pin yourself to if you want to do the bare minimum.
- Hard to dissect: It’s too hard to decode which part of your model is wrong. You just know shit is bad, but not necessarily which shit (is it churn? is it market saturation?)
- “I have some good news – we know you are sick. The bad news is, we don’t know why” – Unhelpful SaaS Magic Number Doctor
- More useful for investors: If I’m an operator, I don’t get a ton of “groundbreaking” insights out of this metric. If I’m below the benchmark, I probably have a pretty good idea that something isn’t working right. I can kinda see how it would be useful for investors as a “high level sanity check” on a binary “go or no go” investment decision. But not for someone in the trenches trying to pull levers to optimize their business.
In the words of the funniest Sales VP I’ve ever worked with:
“You can’t put 10 pounds of shit in a 5-pound bag”
And that’s exactly my gripe – we’re shoving so much shit into the formula that it’s difficult to pull out the five pounds of signal that matter.
What I Like Better
There are different tools for different jobs. If you’re using Magic Number, it feels like you don’t know what job you are trying to accomplish. To a hammer, everything looks like a nail.
So first ask yourself what you want to accomplish. Then peep the list below:
- Efficiency of New Customer Acquisition:
- CAC Payback Period
- Blended CAC Ratio
- New CAC Ratio
- S&M as a Percentage of Revenue
- Quality of Customers:
- LTV to CAC
- Net Dollar Retention Rate
- Customer Expansion:
- Net Dollar Retention Rate
- Expansion ARR to Expansion ARR + New ARR Ratio
- Customer Retention:
- Gross Dollar Retention Rate
- Gross Account Retention Rate
- Account Renewal Rate
- Spend
- Burn ratio
- Months of cash runway
A word from today’s sponsor – Aleph

Aleph helps top finance teams work with their data in real-time. Automate financial models and streamline budgeting and forecasting with the fastest-to-implement FP&A platform. Eliminate the need to export data from multiple sources by syncing your favorite models and spreadsheets in real-time with data from 150+ integrations, and use our web app to visualize data with no-code dashboards.
From annual budgeting to ad hoc reporting, scale your financial processes faster with better data without expanding your team. See why over 90% of people who start a trial with Aleph become customers!
Quote I’ve Been Pondering:
“It is said that the best horses lose when they compete with slower ones, and win against better rivals. Undercompensating from the absence of a stressor, inverse hormesis, absence of challenge, degrades the best of the best.”
-Antifragile by Nassim Taleb