Your guide to 2023 SaaS benchmarks
📈 New benchmarks, how do you stack up?
👋 Hi, it’s Kyle from OpenView. Welcome to another edition of Growth Unhinged, my newsletter that explores the playbooks and hidden tactics behind today’s best startups.
If I’ve been *slightly* quieter online lately, it’s because I’ve been deep in Excel analyzing new SaaS benchmarks data from 700+ private companies. Now I’m BEYOND excited to share the findings with this crew. Let’s dive in, shall we? (Grab your coffee first ☕️)Subscribe
I started OpenView’s first SaaS benchmarks report in 2017 (!) because there frankly wasn’t useful metrics data for startups. We didn’t have an objective view into what metrics were “good” and “great” — or what was happening in the industry.
Fast forward to 2023. In partnership with our friends at Paddle, today we’ve released the 7th annual benchmarks report based on data from more than 3,500 companies in aggregate and 700 from this year’s survey.
You can check out the full report at this link. In this newsletter, I’ll unpack the seven insights that stood out to me — and what to do about them.
- How do you compare? Benchmarks across the five big SaaS metrics.
- Fundraising post-Series A is increasingly in the rearview mirror.
- Profitability as optionality. When to reorient your business.
- A higher bar for efficiency. ARR per FTE jumps year-on-year.
- Is expansion the new acquisition?
- How to tell if PLG is working. Exploring product-influenced revenue.
- Bonus: An honest SaaS metrics glossary.
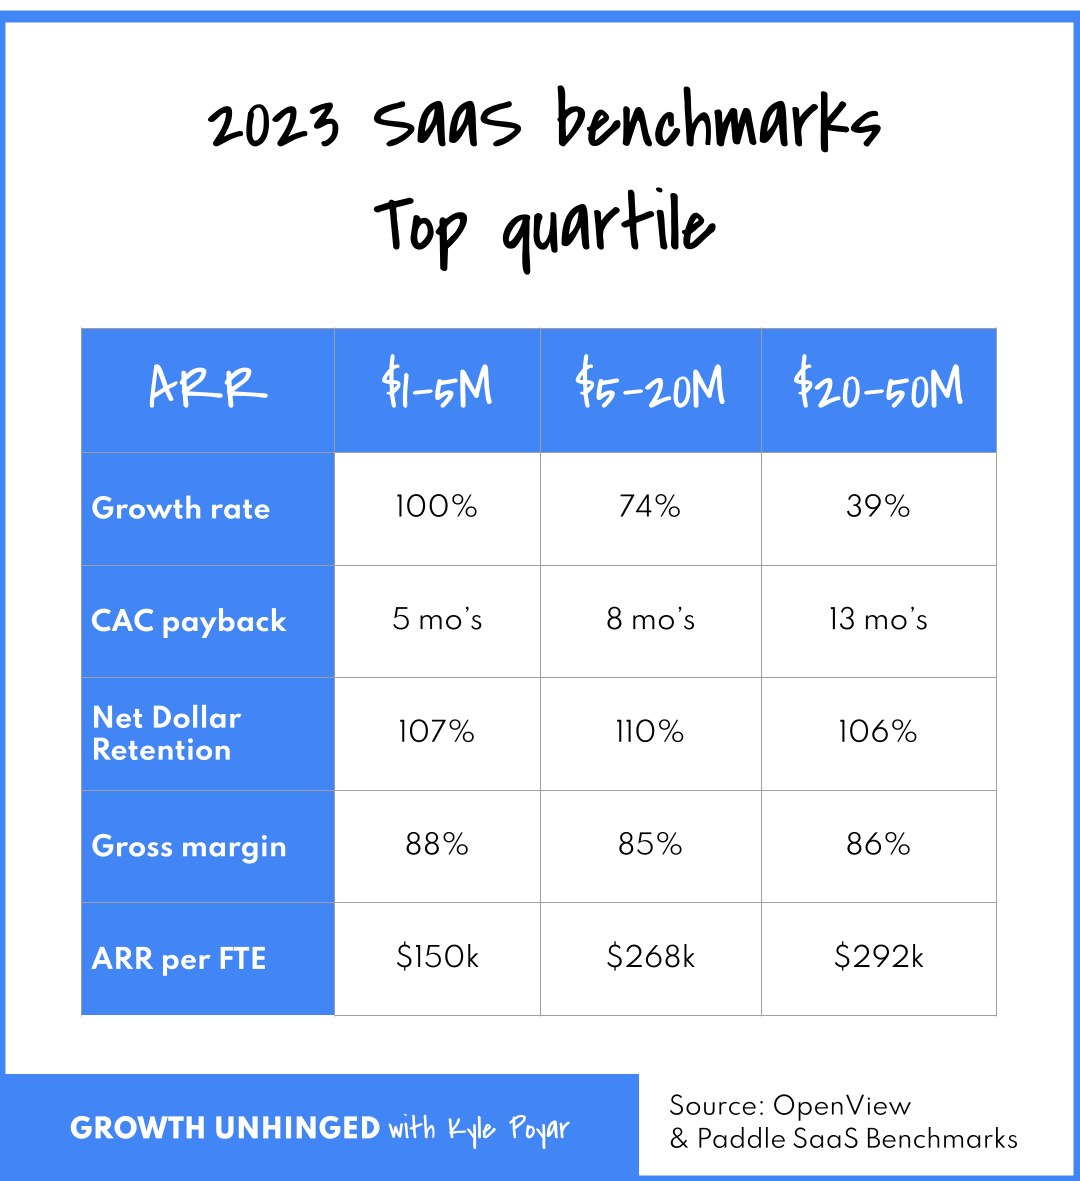
1. How do you compare? Benchmarks across the top five SaaS metrics.
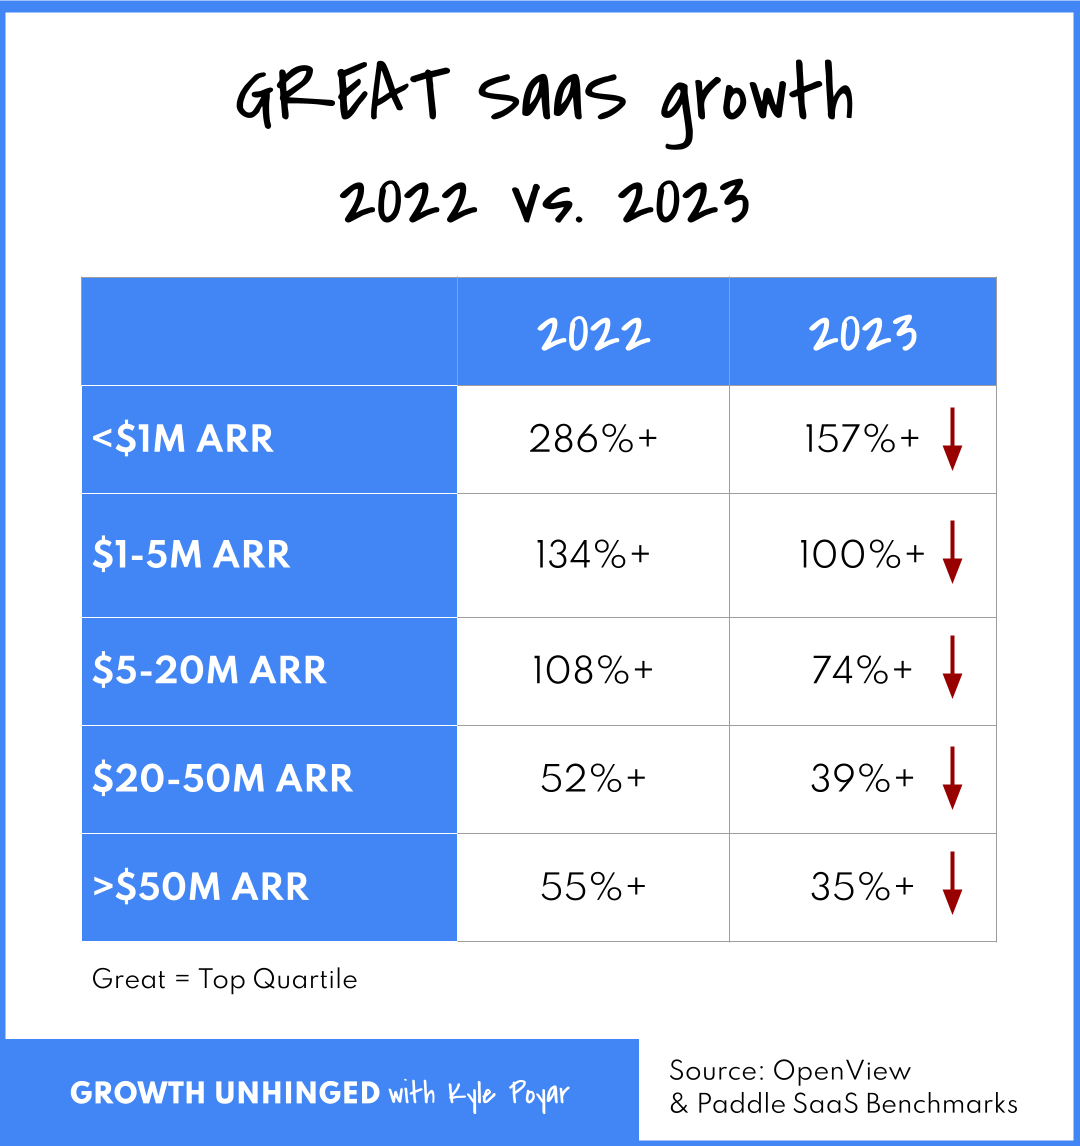
It’s not just your imagination, top quartile growth rates have fallen dramatically year-on-year (for context, we ran the 2022 and 2023 SaaS benchmarks surveys in July-August of the calendar year):
- <$1M ARR: From 286% to 157%
- $1-5M ARR: From 134% to 100%
- $5-20M ARR: From 108% to 74%
- $20-50M ARR: From 52% to 39%
Public companies haven’t been immune, either. The median last twelve month (LTM) revenue growth for public SaaS companies has fallen from 28% (Q2 2022) to 21% (Q2 2023). For public PLG companies, it’s down from 45% to 29%.
2. Fundraising post-Series A is increasingly in the rearview mirror.

Despite the challenging macro-economy, new SaaS products are still getting funded. 30% of Seed-stage companies in the survey said their most recent funding round happened in the past six months; another 20% said it happened between six and 12 months ago.
It’s a very different picture for SaaS companies at Series B or later. Just 14% of Series B companies said their most recent round happened in the past year. Most are still drawing on capital raised in the heady days of 2021.
3. Profitability as optionality: when to reorient your business.
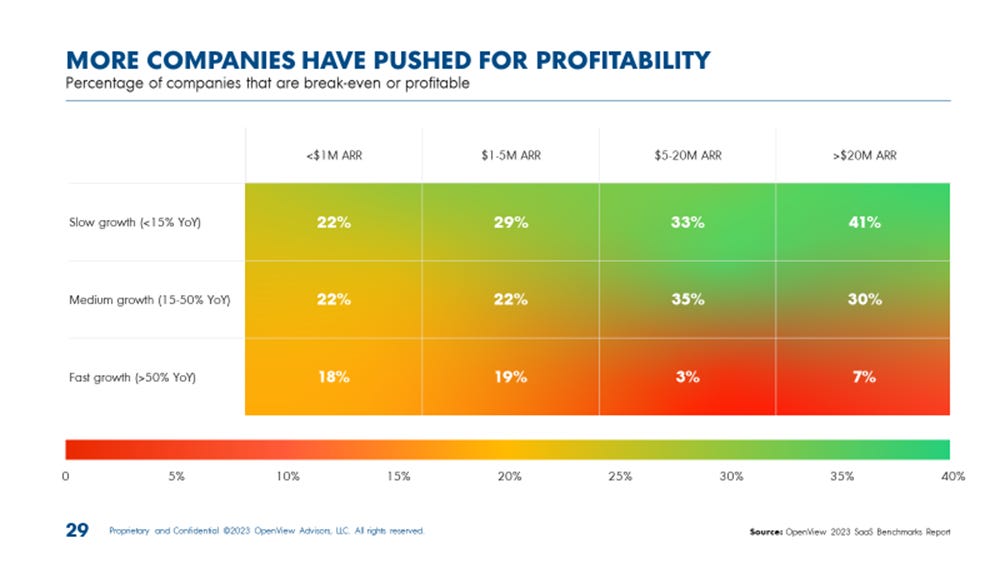
With later stage financing harder to come by, when is the right time to push for profitability?
There are two main axes to consider: year-on-year growth rate and ARR scale.
- For fast growth (>50% year-over-year) companies, profitability is extremely rare. While it’s important to have healthy unit economics, folks are willing to spend money to fuel customer acquisition and product innovation.
- When growth dips below 50%, you see a spike in the percentage of companies that are break-even or profitable — particularly for companies with $5M or more ARR.
4. A higher bar for efficiency: ARR per FTE jumps year-on-year.

SaaS seems to love complicated metrics. I’d be lying if I said I didn’t love a few of them, too. An increasingly important metric is shockingly simple: ARR per FTE. It’s a metric you can’t hide from and you don’t need a CFO to calculate.
SaaS companies are really doing more with less. They’re far leaner relative to ARR and ARR per FTE has increased across the board — especially those between $5-50M ARR.
My two cents on ARR per FTE:
- If you’re looking to emulate public SaaS companies, aim for $250k+ ARR per FTE with ideally a path for $300k+.
- As much as I love ARR per FTE due to its simplicity, the reality is that not every FTE is the same. Global companies hire people across regions, distorting the FTE metric. ARR per compensation $ is a more precise way to measure productivity improvements.
5. Is expansion the new acquisition?
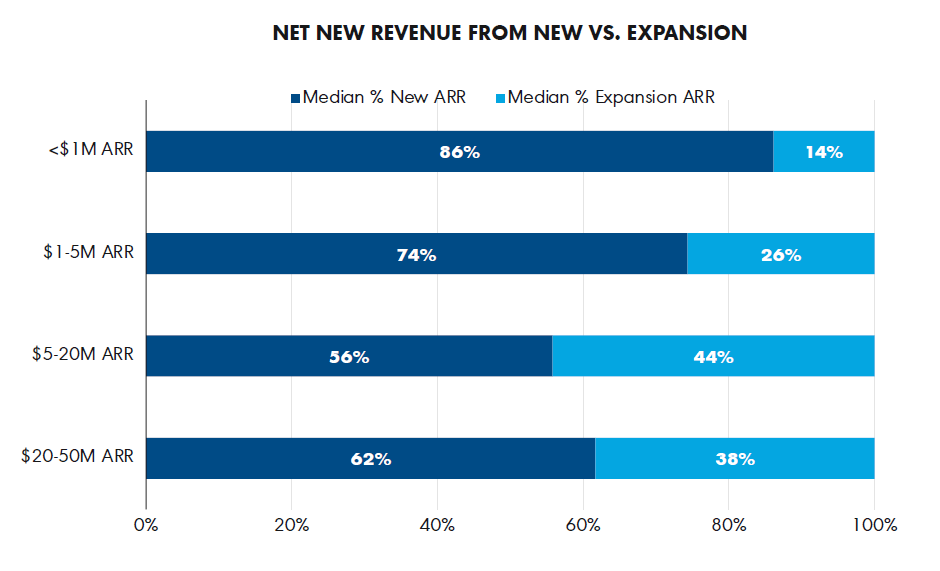
In the early years, acquisition matters most for driving growth. 86% of net-new ARR growth companies from acquisition and only 14% from expansion.
Continued growth at scale comes from accelerating expansion revenue to complement the acquisition motion. For companies with $20-50M ARR, 38% of net-new ARR growth comes from expansion.
Easier said than done, huh? Here’s what I’ve been seeing among companies with powerful expansion motions:
- Multiple pricing levers for expanding customers. This provides optionality if there’s pressure against seats (declining headcount) or usage (cost optimizations).
- Product roadmap prioritized based on willingness-to-pay.
- Minimize friction in going from individual user > team > company adoption. (I wrote more about that earlier this year.)
6. How to tell if PLG is working. Exploring product-influenced revenue.

Today we look for PLG investments to drive incremental growth as well as to efficiency by taking work that would usually be done by people and replacing it with product-based solutions.
One emerging metric to assess PLG performance is product-influenced revenue: how much net-new revenue is from customers who start with a meaningful product interaction before ever talking to sales. (I previously covered this metric in my interview with Ben Williams, Former Growth Leader at Snyk.)
Product-influenced revenue is highest among SaaS companies with a self-serve freemium offer, representing about 90% of total revenue. That said, offering a freemium plan is not enough. Product-influenced revenue can swing from 28% at the bottom quartile to 100% at top quartile companies.
Thanks for reading Growth Unhinged! If you <3 this post, please support the newsletter by liking, subscribing, or sharing with a friend.Subscribe
7. Bonus: An honest SaaS metrics glossary.
The SaaS metrics covered in this newsletter are only scratching the surface. Here’s a handy glossary of the rest and what they actually mean 😂

What else you should know
- Go read the full 2023 SaaS benchmarks. Then drop a comment with your favorite insights and/or any questions on the data.
- Check out my guide to SaaS metrics 2.0, making the case for a next era metrics playbook in the age of product-led growth.
- Andrew Davies (CMO, Paddle) and I are teaming up to delve into the survey data in a virtual fireside chat on November 16th. Save your spot.