Finding Dissonance in Sell-side estimates
What matters to an IR person
In this Thursday’’s edition I will expand upon the first topic of risk from last week.
Talking about IR team impact map
Chasing Dissonance May 1

What does an IR person do?
Why are sell-side analysts important?
Imagine a room. In one corner: management, spinning their narrative. In another: investors, hungry for insight. In the middle, holding a stack of spreadsheets and a red pen, stands the sell-side analyst. Their job? Translate, interrogate, and sometimes, instigate.
Thanks for reading! Subscribe for free to receive new posts and support my work.Subscribe
Sell-side analysts-those folks at investment banks and research shops-are the ones who pick apart public companies and industries, then stitch together reports with price targets, buy/sell/hold calls, and financial forecasts. But their real power? It’s in the consensus. Their models feed into the consensus estimates that investors use as the North Star. Miss the consensus, and your stock price might tumble. Beat it, and you’re a hero (for a day, at least).
But consensus isn’t just a number. It’s a living, breathing benchmark that reflects not only management’s guidance, but also the collective wisdom (and folly) of the analyst crowd. When those estimates are dialed in, the market narrative feels grounded. When they’re scattered, uncertainty creeps in-and that’s where risk starts to whisper.
The Analyst as Interpreter and Instigator
Analysts aren’t just number crunchers. They’re interpreters, relaying management’s story to investors and providing the context that helps everyone make sense of the noise. Their questions on earnings calls, their focus in reports-these are signals, telling IR teams what’s on investors’ minds, what’s misunderstood, and what’s keeping people up at night.
And the relationship? It’s not a one-off transaction. Analysts show up quarter after quarter, at conferences, on roadshows. They’re long-term partners (and sometimes, worthy adversaries) in shaping how the market sees a company.
When Consensus Goes Off the Rails
Here’s where things get interesting. Sell-side estimates are aggregated by platforms like IBES and FactSet, and investors watch them like hawks. Miss by a penny, and you might see your valuation rerated. But what happens when the estimates themselves are all over the place?12
Academic research tells us that when analyst estimates are dispersed-when there’s no clear consensus-returns tend to be lower. Uncertainty is the enemy of premium multiples. The market doesn’t like not knowing.3
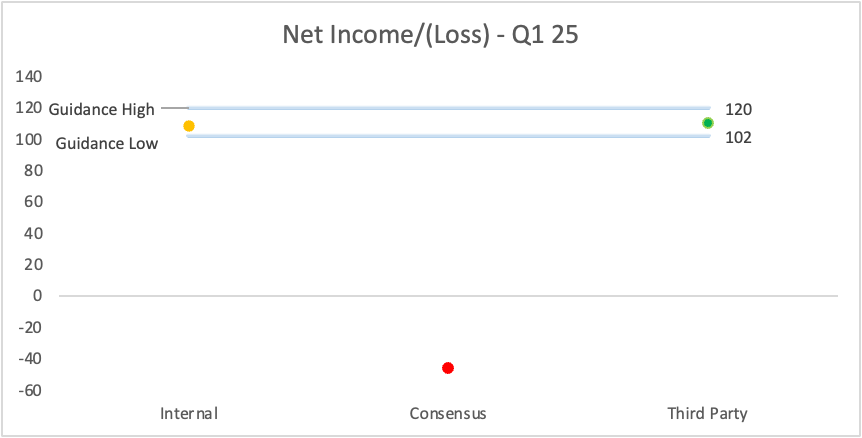
So, what’s an IR pro to do? First, get curious. Compare the consensus with your internal numbers. Where’s the dissonance? Which line item is out of whack? Drill down: Which analyst is the outlier? What’s driving their model? Did they mention something in their report that explains the deviation, or is it a formula error lurking in a spreadsheet cell?
This is detective work, not just data entry or just monitoring and reporting the numbers to upper management. The goal isn’t to browbeat the analyst, but to understand the narrative their model is telling. Maybe there’s a good reason for the divergence-or maybe it’s just a blank cell throwing off gross margin by 30 percentage points.
The Human Side of Tightening Consensus
At the end of the day, it’s about relationships. The tighter and more accurate the consensus, the more confident the market feels-and the higher the potential for your stock’s valuation. That means staying engaged, keeping the dialogue open, and helping analysts refine their models so the story they tell is as close to reality as possible. This means identifying the root causes for differences in the numbers, it might be one assumption difference in an underlying line item to the main item like revenue or EBITDA that is causing the deviation and reviewing that with the analyst.
How we solve this problem using our analytics platform and AI
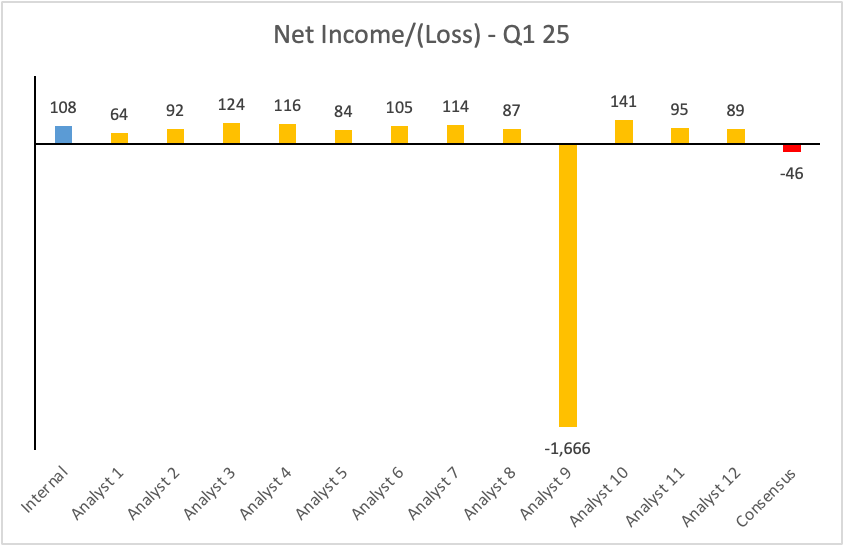
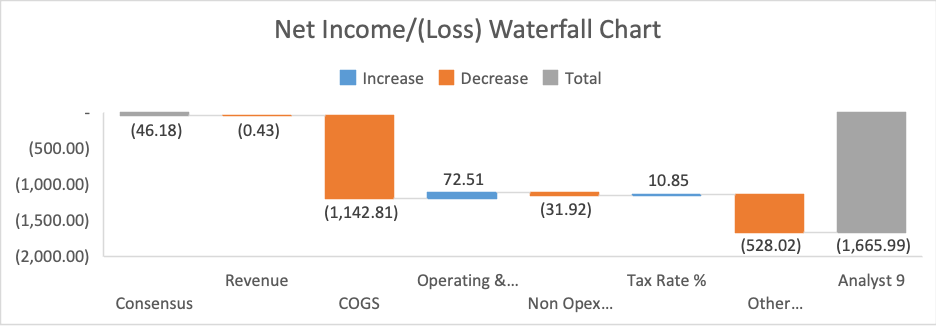
Virtua’s solution: Instead of wading through endless tables and charts, you ask a simple question-“Which analyst is causing the deviation, and why?”-and get a clear answer. Something like:
“Analyst #9 has projected revenue on the lower end compared to consensus. Their gross profit calculation references a blank cell, resulting in an unrealistically low margin. This overstates COGS, which drags down net income versus consensus.“
That’s not just data; that’s insight. That’s the kind of clarity that lets IR teams focus on what matters: telling a story the market can believe in.
Instead of going through endless screens of BI dashboards, excel and powerpoint files, ask our platform the question you care about and get answers that matter!
What’s next?
1 Henry A. Latané and Charles P. Jones (1979) Standardized Unexpected Earnings–1971-77, The Journal of Finance, Vol. 34, No. 3 (Jun., 1979), pp. 717-724
2 Bernard, Victor L., and Jacob K. Thomas (1989). “Post-Earnings-Announcement Drift: Delayed Price Response or Risk Premium?” Journal of Accounting Research, 27, 1-36.
3 Diether, Karl B., Malloy, Christopher J., Scherbina, Anna (2002) “Differences of Opinion and the Cross Section of Stock Returns” Journal of Finance, Vol. 57, No. 5 (Oct., 2002), pp. 2113-2141