Mostly made up: Growth adjusted gross profit per employee
First off, thanks to everyone who joined the “Mostly talent collective”. We had over 50 people join in the first week 🤯. The collective now includes candidates from companies like PwC, Bain, and McKinsey, all looking to join high growth startups🧠.
So, of course, I had to take the good boy for ice cream🍨 to celebrate.

If you’re an employee looking for your dream job, you can get on board 👇🏾
And if you’re an employer looking to supercharge your finance, strategy, or operations muscles, find them here 👇🏾
Now on to the meat🥩and potatoes🥔 of today’s post – I teamed up with my friends at Virtua Research to bring a metric I’ve had bouncing around in my head for a couple of years to life.
It’s called Growth Adjusted Gross Profit per Employee.

Here’s how it works:
- Take a company’s Gross profit (Revenue less Cost of Goods Sold)
- Divide that by the number of employees they have on board (total headcount)
- Multiply that by (1 + y/y revenue growth)
Here’s an example comparing two fictional companies:
Company A:
- Revenue of $120M
- Gross Margin of 74%
- Employee count of 500
- Revenue growth rate of 30%
- Step 1: $120M x 74% = Gross Profit of $89M
- Step 2: $89M / 500 employees = $178K Gross Profit per Employee
- Step 3: $178K x (1 + 30%) revenue growth rate = $231K per Employee
Company B:
- Revenue of $200M
- Gross Margin of 62%
- Employee count of 1,500
- Revenue growth rate of 60%
- Step 1: $200M x 62% = Gross Profit of $124M
- Step 2: $124M / 1,500 employees = $83K Gross Profit per Employee
- Step 3: $83K x (1+ 60%) revenue growth rate = $133K per Employee
Company A comes out as the more efficient operator, and a potentially better bet. Even though Company A isn’t growing as fast as Company B, it has a healthier gross margin and is generating more Gross Profit per employee.
With that example under our belts, let’s get familiar with the formula’s components and why they’re important.

Gross Profit:
- At the end of the day, the higher your gross profit, the more money you have to run the rest of the business.
- A gross margin of 74% (a rough median for software companies) means that for every $1 the biz brings in, 74 cents is left over for salaries, rent, and other OPEX (including those ugly laptop backpacks they give out each year at your company sales kickoff).
- Margins matter – take it from my friend Kyle Harrison, who dove into why Twilio is trading at a MASSIVE discount to other high growth SaaS companies like Atlassian and DataDog:
So when companies like Datadog and Atlassian are trading at ~10-15x revenue, why is Twilio down at ~1.5x revenue?
In part? Gross margins.
Remember that Twilio has ~50% gross margins.
Datadog? 77%
Atlassian? 84%
Cloudflare? 78%
Right out of the gate, that $2.8B in revenue? It’s costing Twilio ~2.5x more to get it.
I believe we should STOP talking so much about revenue multiples and START talking more about multiples of Gross Profit.
Why?
Well, as a friend of mine likes to say:
“I love Revenue, but if I fed my dog Revenue, he’d die. He needs Gross Profit to survive.”
Gross Profit is the lifeblood of any business. Companies can’t just trade a dollar for a dollar forever (unless it’s the Costco $1.38 hotdog).
Now, with that being said, you might say why don’t we just look at profitability?
I don’t want to over rotate and only size up companies based on their profitability. I think that too misses the forest through the trees when you are talking about high growth tech firms.
EBITDA multiples are cool, but there are times when you are chasing a market opportunity and it makes sense to burn cash, IF you can still protect your gross margin, which will eventually be your route to scalability. Tech markets come with windows of opportunity, and the difference between being #1 vs #2 in a market is huge.
Gross Profit per Employee
- This is a remix of one of my favorite metrics, Revenue per Employee
- Revenue per employee is a simple metric that cuts through all the noise
- There’s no hiding from it – just take the amount of revenue you’re generating and divide it by the number of people on board
- This should go up over time, and demonstrate leverage in your business model.
- With Revenue per Employee, ideally you get close to $250K or $300k per person when you approach $100M in revenue
- So for Gross Profit per Employee, ideally you get into the $200K to $250K range as you approach scale (on an annualized basis)
- This is something companies should track closely to make sure they aren’t getting out over their skis with hiring during hyper growth
Revenue Growth Rate
- Best measured on a TTM (trailing twelve month) basis
- No matter how you slice it, high revenue growth covers up a lot of sins
- The question this formula assess is… just how many sins?
So what’s the point?
The point of this formula is to balance business model scalability (Gross Profit) with operational leverage (Gross Profit per Head) and ability to execute on the sales side (Revenue growth rate).
When I look at a company to work for, advise, or invest in, I want to have faith in where they’re going. I’m very willing to accept that not all companies will be profitable RIGHT NOW.
Applying the metric in real life:

Here’s Crowdstrike ($CRWD) vs their Cyber Security sector cohort. You can see they are generating $15K to $25K above the industry median and average. It makes sense why investors are willing to pay a premium – not only is their Gross Profit healthier than most, they are generating it with a sensible number of employees on board, and growing faster than the sector. A few more examples…
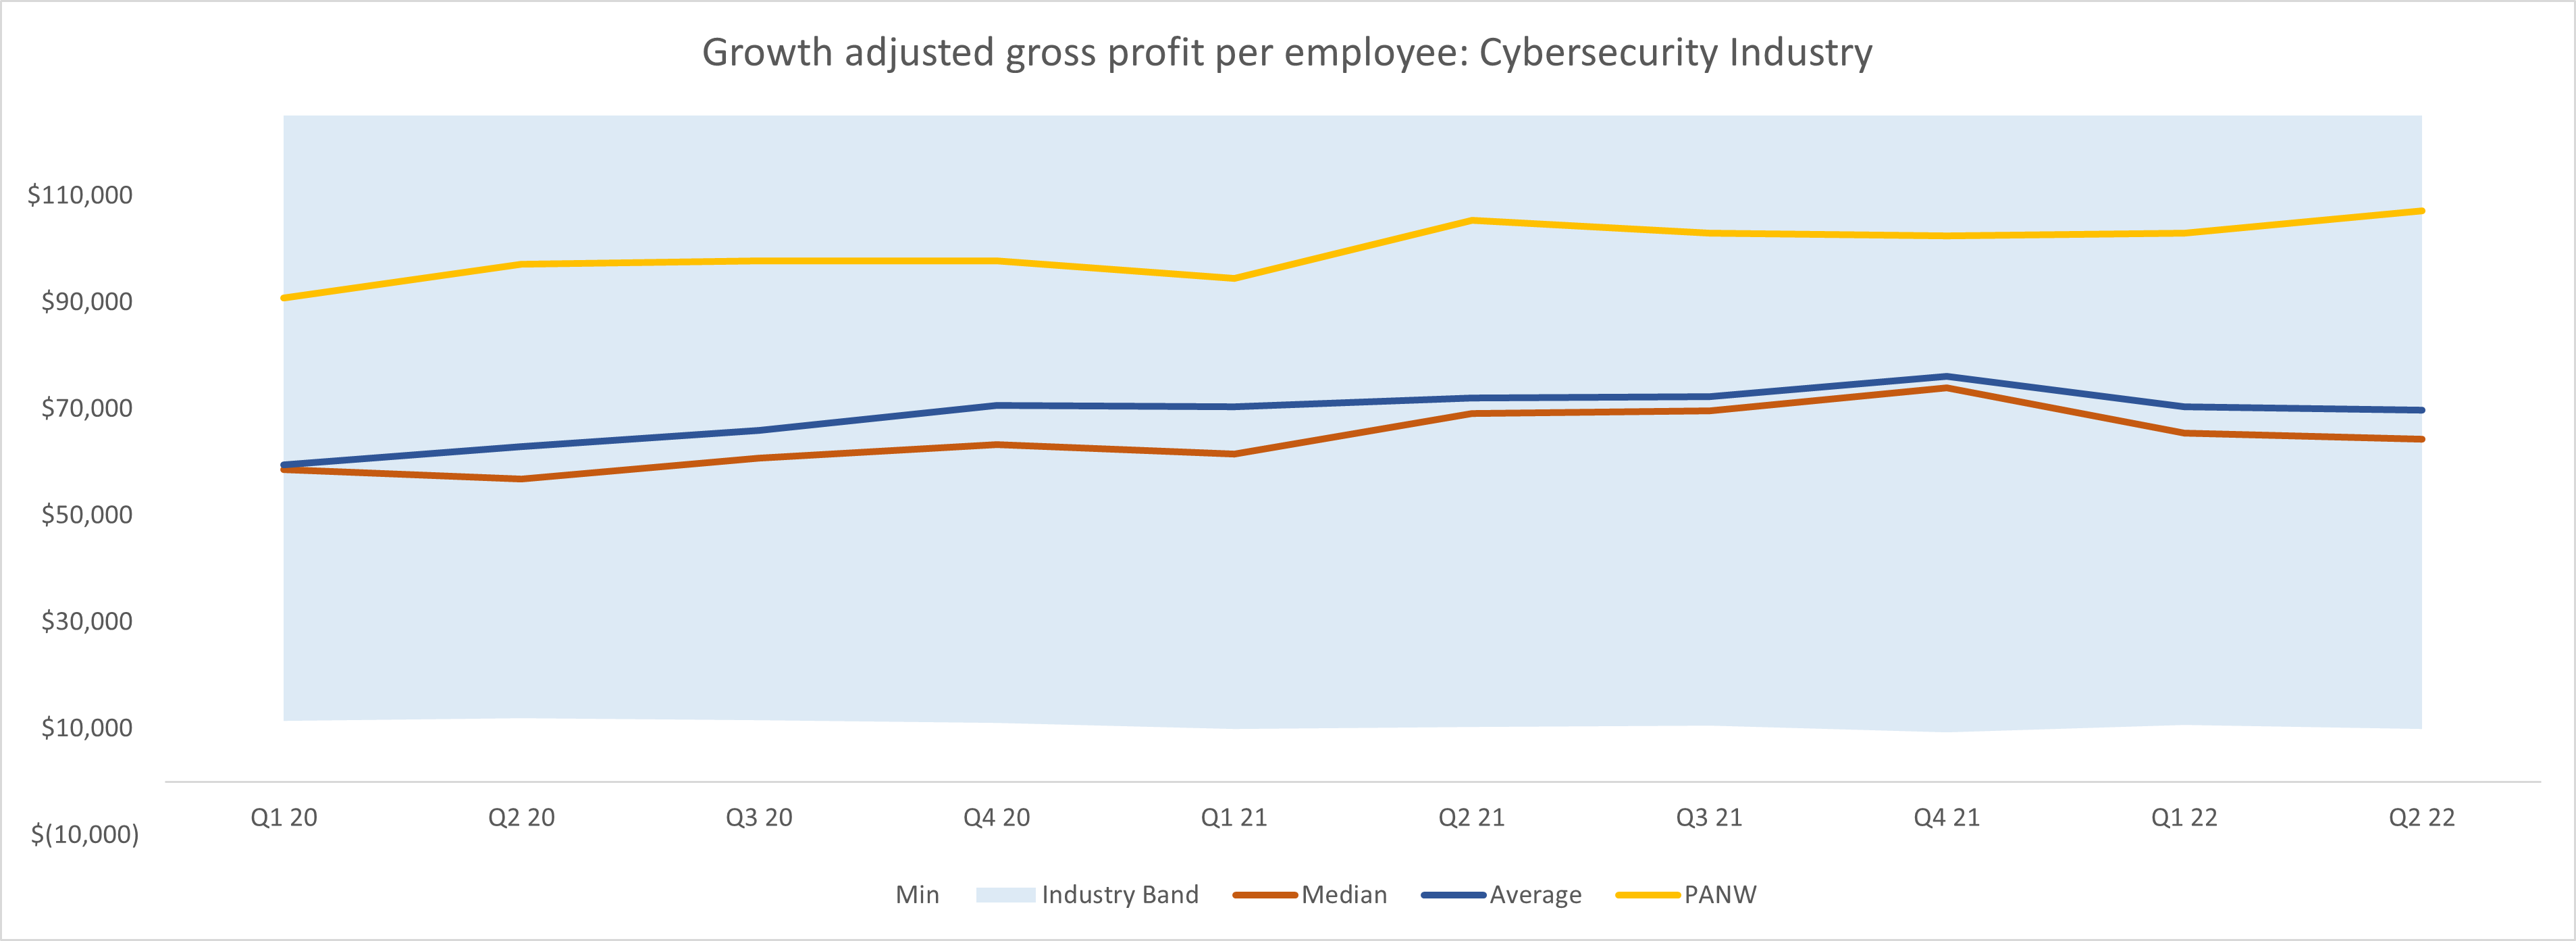
A(nother) cybersecurity company outperforming: Palo Alto ($PANW)
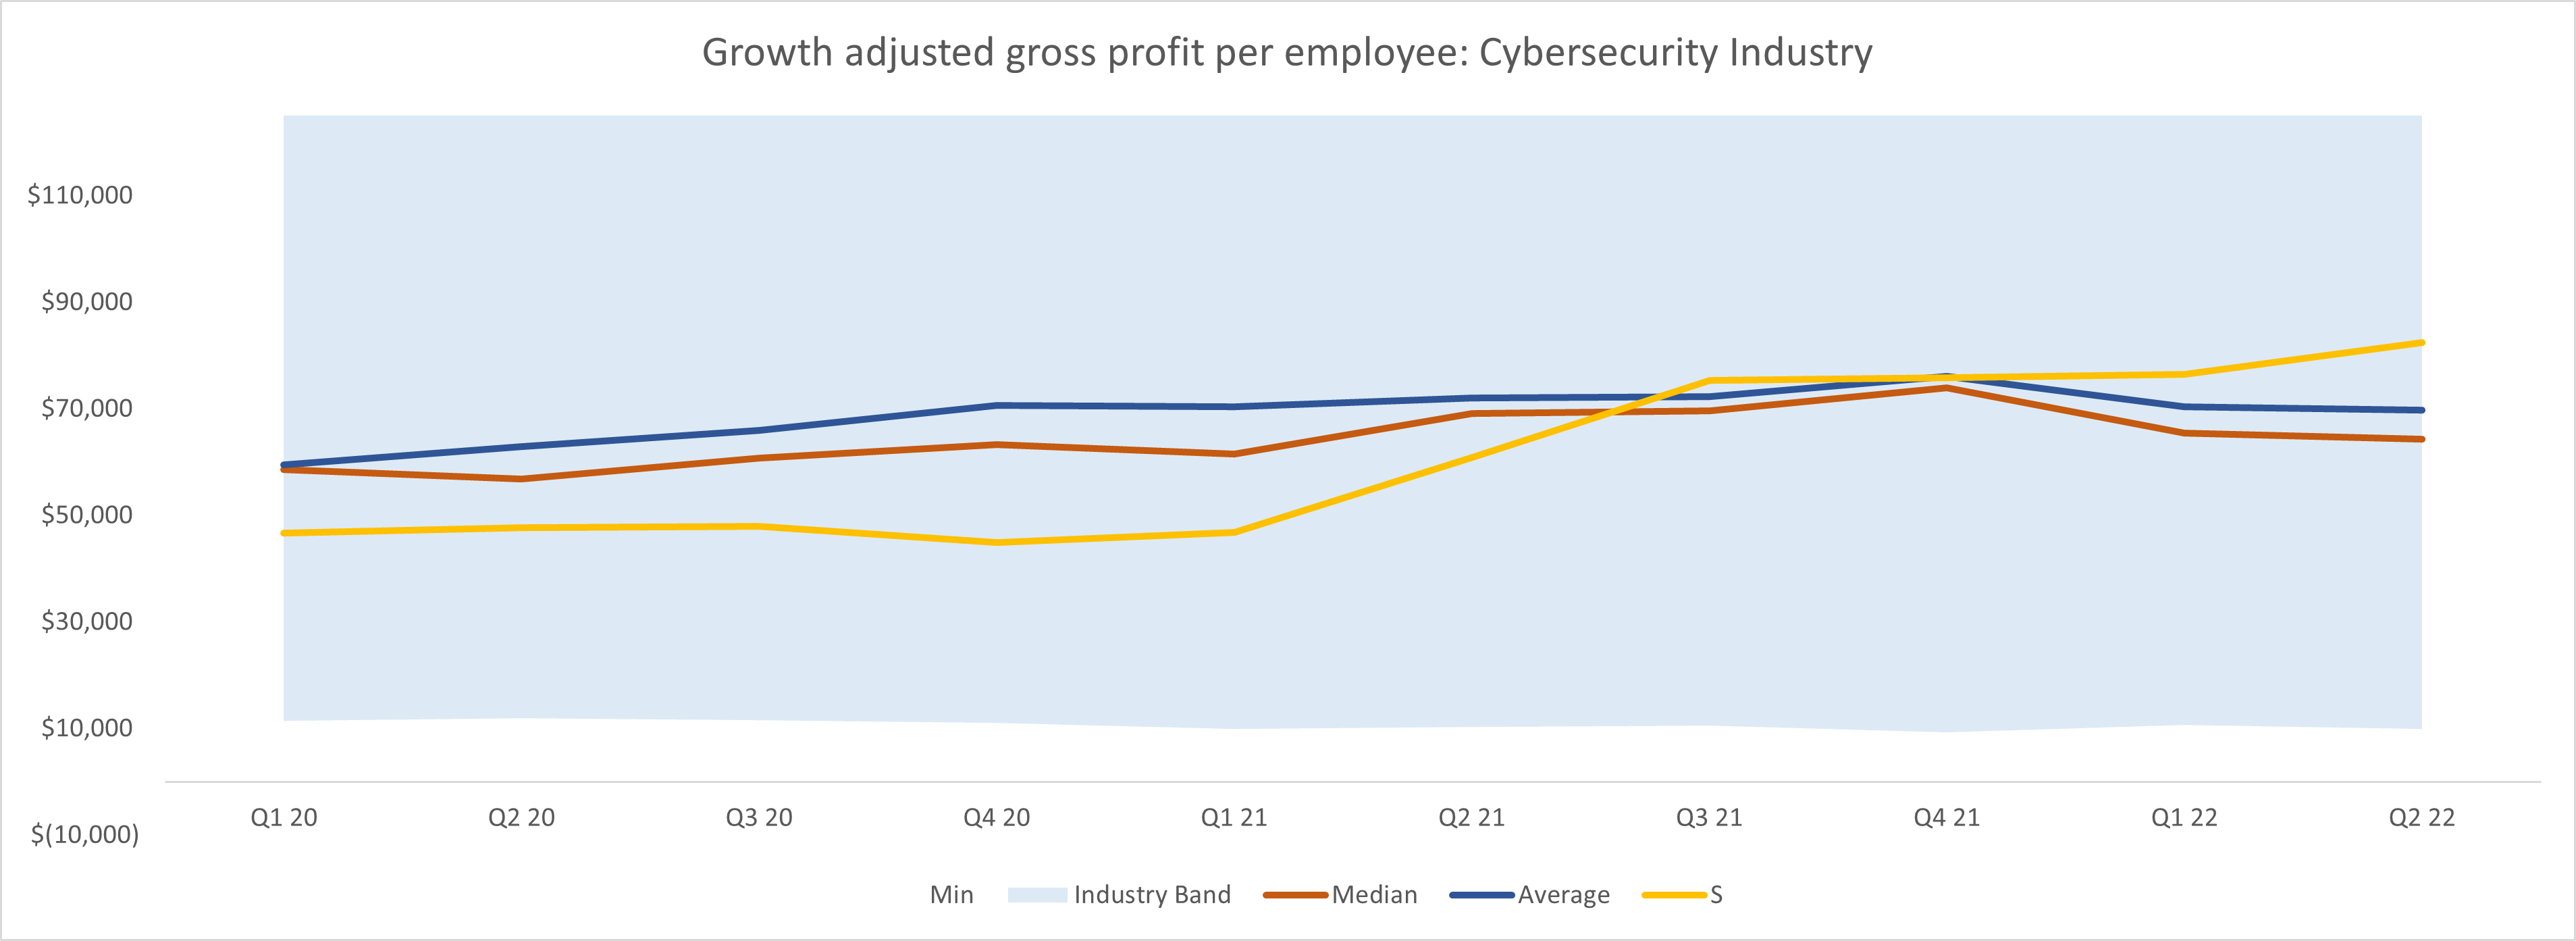
A cybersecurity company on the rise: Sentinel One ($S)
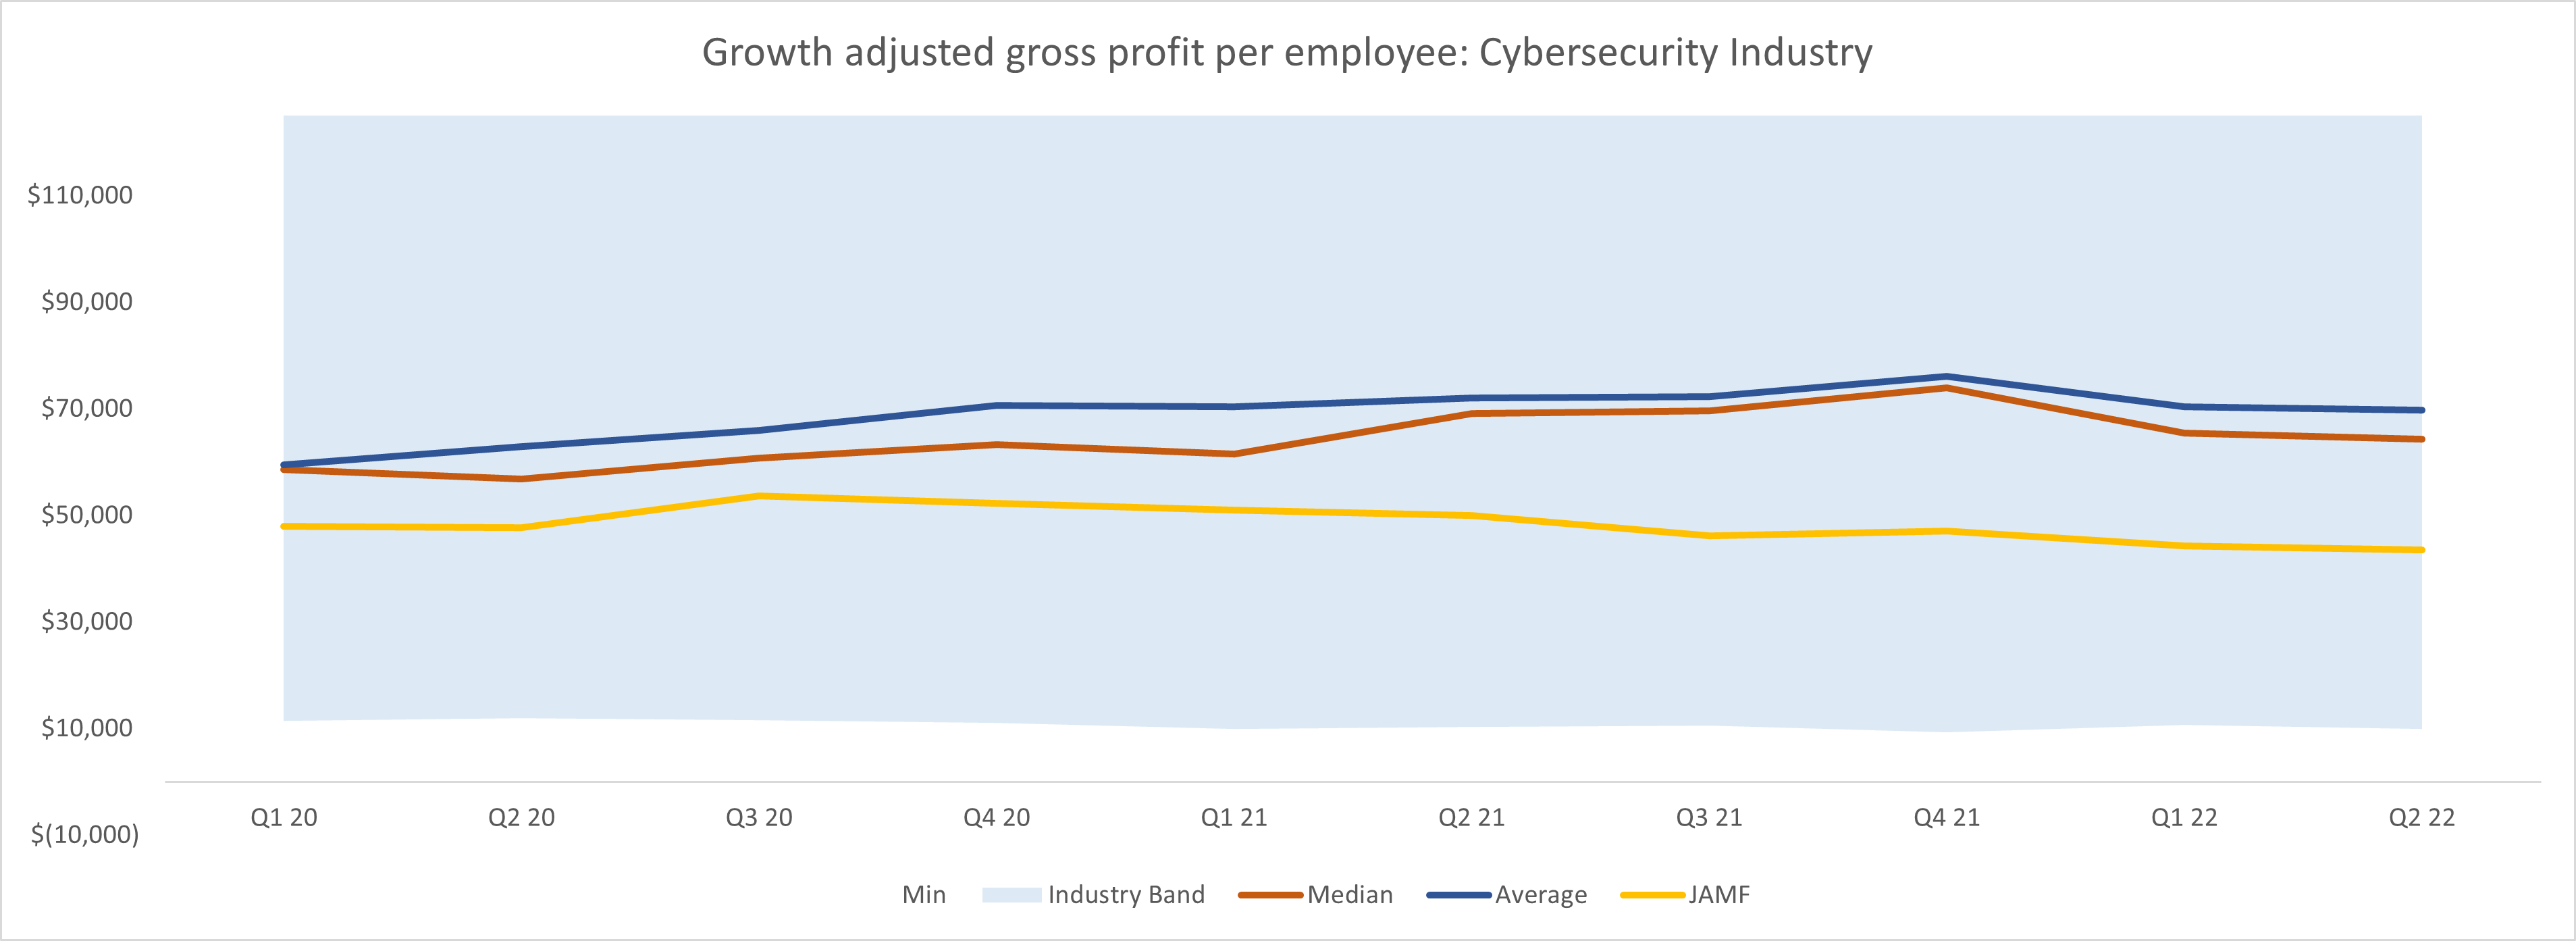
A cybersecurity company underperforming: JAMF.
Putting it to use
This metric, in my (made up) opinion, is best used to compare high tech growth companies who are later in their lifecycles (+$100M ARR, post series C, or post IPO) with similar monetization models.
I think it’s also interesting to not only compare companies vs one another, but also check how a single company is trending over time – are they getting better at what they do?
I’m going to start tracking Growth adjusted gross profit per employee as my own personal “index” of sorts.
As a metrics wonk, it combines three of my favorite signals into one. I think looking purely at revenue multiples quarter to quarter is misleading. You can still go fast and grow like crazy, but have a rotten core that’s ripe for burn out.
And I don’t think we should only care about profitability. Like, how boring is that? If you want slow growth and high profitability, go buy a car wash or dry cleaning business. (I joke, I joke, I joke).
So there it is – Growth adjusted gross profit per employee.
Next time we revisit this metric we’ll size up the DevOps industry to see how companies are performing.
What I’ve been reading
As a business leader, you have a few big decisions that will 10x your growth or sink your business.
That’s why I’m a big fan of Brian and his newsletter. Every week he shares simple tips to help you make the big choices that grow your business.
Join 7,000+ business leaders and check out The Competitive Edge to help position your business to grow
Subscribe to The Competitive Edge
Quote I’ve been pondering
“At no point in your rambling, incoherent response were you even close to anything that could be considered a rational thought. Everyone in this room is now dumber for having listened to it. I award you no points, and may God have mercy on your soul.”
-Principal in Billy Madison